9 ฐานเรียนรู้
ความรู้ที่น่าสนใจ (Documents on web)
ติดต่อเรา
มูลนิธิกสิกรรมธรรมชาติ
เลขที่ ๑๑๔ ซอย บี ๑๒ หมู่บ้านสัมมากร สะพานสูง กรุงเทพฯ ๑๐๒๔๐
สำนักงาน ๐๒-๗๒๙๔๔๕๖ (แผนที่)
ศูนย์กสิกรรมธรรมชาติ มาบเอื้อง 038-198643 (แผนที่)
User login
ลิงค์เครือข่าย
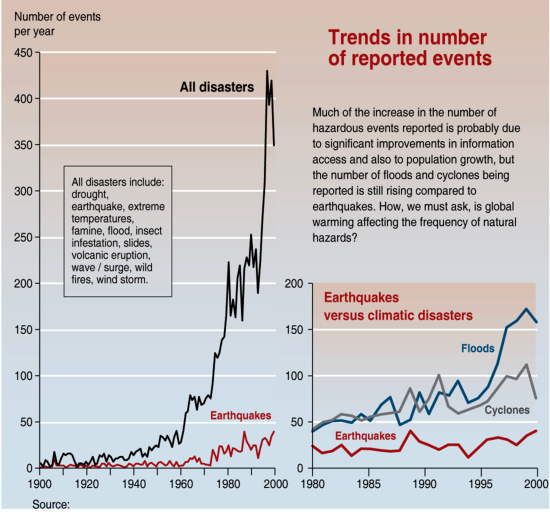
กราฟแสดงภัยพิบัติธรรมชาติทั่วโลก

กราฟแสดงภัยพิบัติธรรมชาติทั่วโลก เพิ่มขึ้นอย่างมีนัยยะสำคัญ แม้ส่วนหนึ่งจะมาจากการสื่อสารที่รวดเร็วข
Trends in natural disasters. With growing population and infrastructures the world’s exposure to natural hazards is inevitably increasing. This is particularly true as the strongest population growth is located in coastal areas (with greater exposure to floods, cyclones and tidal waves). To make matters worse any land remaining available for urban growth is generally risk-prone, for instance flood plains or steep slopes subject to landslides. The statistics in this graphic reveal an exponential increase in disasters. This raises several questions. Is the increase due to a significant improvement in access to information? What part does population growth and infrastructure development play? Finally, is climate change behind the increasing frequency of natural hazards?
แหล่งที่มา:
วารสารจุดเปลี่ยน => Centre for Research on the Epidemiology of Disasters (CRED)


